6 Dashboard Metrics for Your LPA Program

Implementing layered process audits (LPAs) in your facility can mean conducting hundreds of audits every single month, a process that generates a large volume of quality data.
As manufacturers lean into Industry 4.0 initiatives, that volume of data is only growing. But according to Forrester, up to 73% of data within businesses never gets analyzed.
How can automotive and aerospace manufacturers leverage more of their LPA data to maintain steady progress towards their quality goals?
The answer lies in dashboarding, which allows teams to keep their most important metrics front and center for more effective communication and goal-setting. This post looks at some of the most critical numbers to focus on in order to ensure your LPA program is effective at driving down defects, complaints and costs.
1. Audit Completion Rate
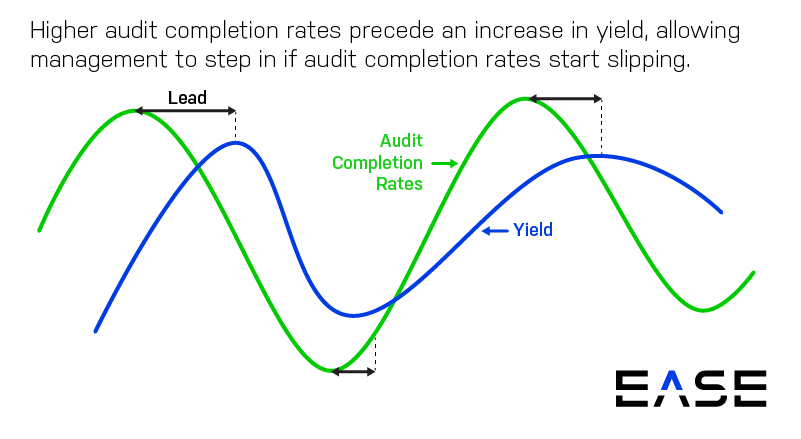
One of the most important LPA metrics to keep and monitor on your dashboard is audit completion rate. Audit completion rate is a leading metric that’s inversely correlated with key quality metrics like PPM, scrap and quality costs.
When audit completion rate goes up, process errors that cause defects go down. Tracking leading metrics allows you to take action before serious problems occur. So when you see audit completion rates slipping in certain departments or production cells, you can step in before it causes a ripple effect on quality.
Boosting audit completion rates is a major reason manufacturers automate layered process audits. Doing so can help raise completion rates to 90% or more, according to professionals surveyed in our 2019 State of LPA report.
2. Past Due Corrective Actions
More than 50% of survey respondents cited overdue corrective action requests as one of the most important performance metrics to track. As the backlog of uncompleted corrective actions grows, it allows problems to persist longer, leading to more defects, more complaints and higher quality costs. It’s another leading indicator that can provide critical warning of problems, so you can take action faster.
Implementing LPA automation can help you:
- Link audit failures to corrective action requests
- Assign responsible parties, action items and deadlines
- Automate alerts when key tasks aren’t completed on schedule
3. Average Time to Closure
Closely related to the number of past due corrective actions is the average time to closure, yet another leading indicator that can signal impending quality failures.
Keeping an eye on average time to closure lets you investigate bottlenecks in the corrective action process so you can solve problems more efficiently and effectively. It also gives you a target to shoot for as you communicate your key metrics with your team.
4. Nonconformance Metrics
Many manufacturers track a range of nonconformance metrics related to LPAs, including:
- Failed questions
- Corrective actions
- Ratio of failed questions that resulted in a corrective action
- Nonconformances by department and work cell
One tool that can help you visualize LPA metrics is a Pareto chart, which allow you to assess the relative contribution of various failure types. For instance, you might notice a disproportionate number of process nonconformances in the tempering department, allowing you to focus your problem-solving for maximum impact.

5. Number of Checklists
If you’re trying to evaluate LPA effectiveness at a high level, for example when working with multiple sites, one dashboard metric to track is the number of checklists per organization.
How does the number of LPA checklists relate to quality? It all comes down to engagement. When teams are actively participating in LPAs, they should be developing unique checklists for each work cell—not just using generic checklists applied to multiple areas.
6. Audit Completion Time
Tracking audit completion time can help you identify pencil-whipping where employees are rushing through audits and just checking off items. It’s a common problem with LPAs, where having to conduct a large volume of audits leads some people to simply check the box.
If people are completing audits in 10 seconds flat, you know you need to look into this problem. And if you’re using an automated LPA platform, you can track averages across sites, users and layers to identify broader trends for improving your LPA program.
Ultimately, it’s important to remember that the metrics you track depend on your individual objectives. A plant manager’s dashboard might look quite different from, say, the director of quality’s dashboard, which might incorporate LPA data from multiple sites.
The key is using a mix of leading and lagging metrics, helping you proactively spot trends and make connections between different pieces of data. By making these connections, the effort you put into your LPA program is multiplied, going beyond individual defect prevention to organization-wide performance improvement.