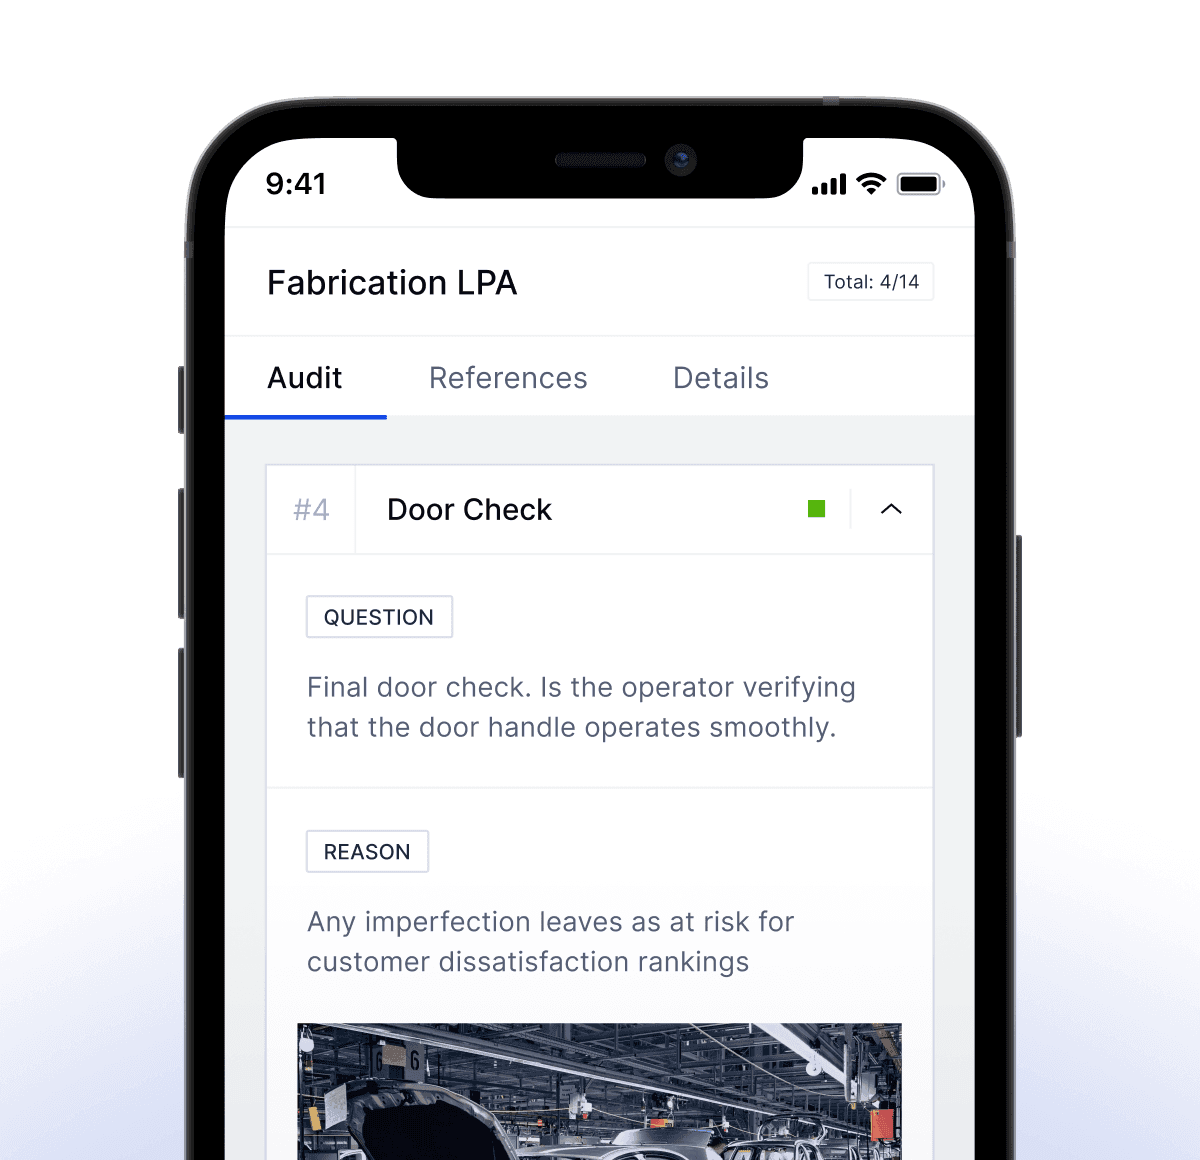
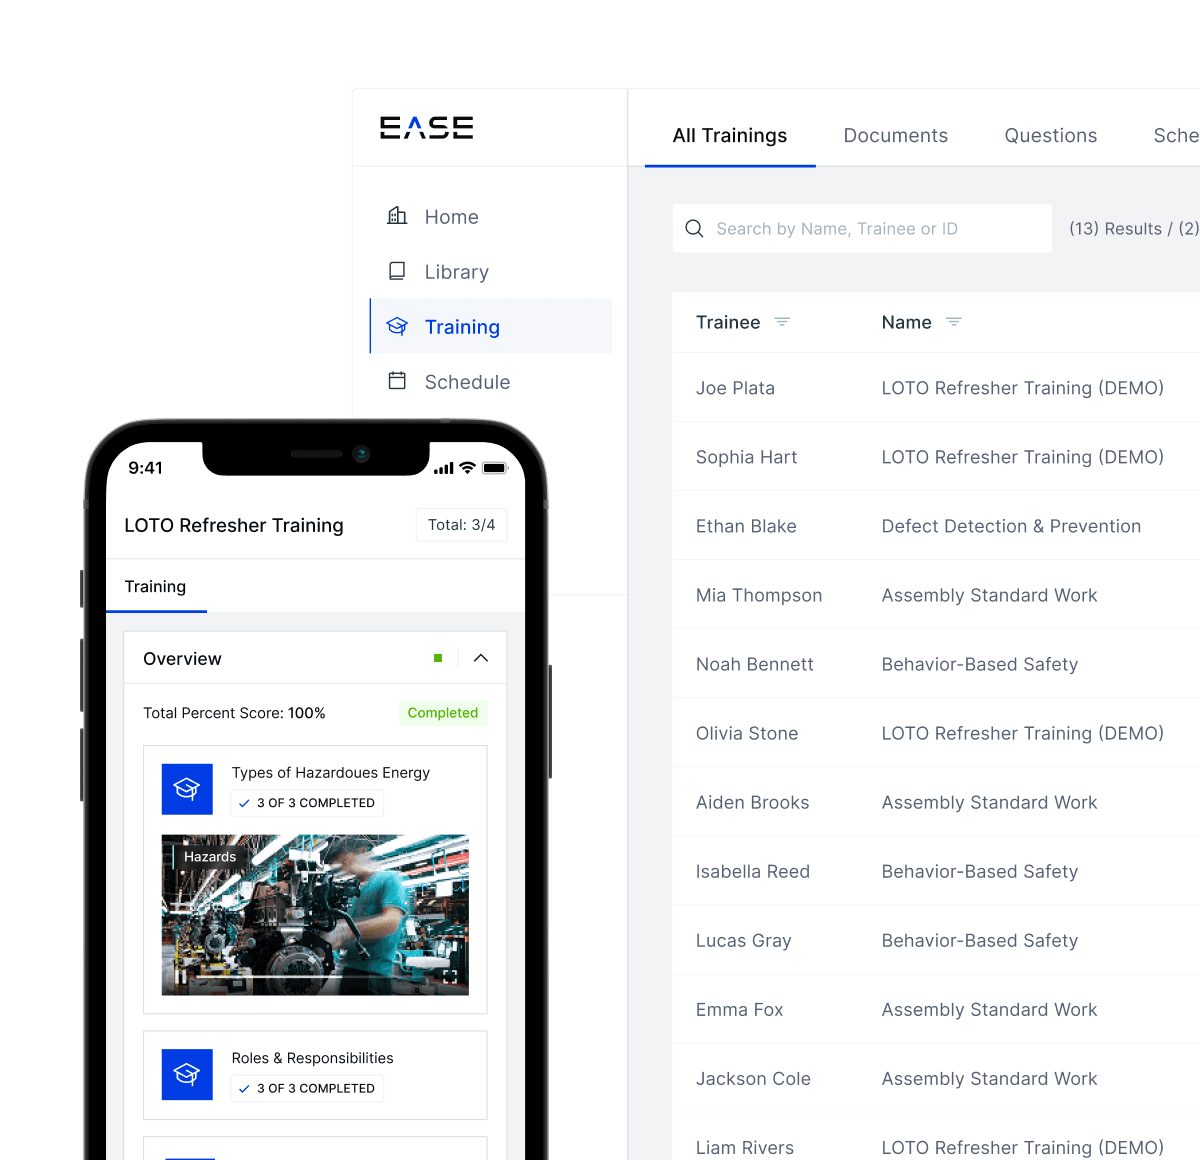
Do more with your data.
Visualize your plant floor data and act upon it on-the-go, all from a single, user-friendly dashboard. With a new and improved way of viewing and managing processes, you can drive operational excellence effortlessly.

See the bigger picture.

Company-wide visibility
Gain visibility into your plant floor operations at individual or multiple sites.

Smart decisions on-the-spot
Leverage out-of-the-box and custom dashboards to track, trend, and resolve drivers of non-conformance.

Time and money saved
Wave goodbye to tedious data entry and focus on what matters most.
Your data, your way.
Configure dashboards and visualizations to highlight the most relevant KPIs for your operation. Easily generate and share detailed reports with multiple stakeholders.

Unlock & share real-time insights.
Transform your audit data into smart, actionable insights in a few clicks, with real–time, easy to read reports.

Single Site Reports
Manage individual plant performance with granular reports, empowering local teams to drive improvements.

Multi-Site Reporting
Bring data from various locations together for better strategic decision making.

Powerful Custom Dashboards
Produce and share in-depth reports easily so you can pinpoint trends and issues more easily.
Common Questions
Yes, EASE moves reporting beyond simple completion tracking. The platform’s out-of-the-box reporting and dashboards allow you to configure reports on performance metrics such as Top Non-Conformances by Location, Shift, Process, and Audit Question. You can easily filter and trend data to pinpoint specific failure points, allowing your teams to transition from broad compliance checks to targeted, data-driven process improvement initiatives.
Yes, EASE is designed for proactive risk identification. The reporting features include trend analysis capabilities that visualize non-conformance frequency over time. By tracking recurring failures and low-scoring process steps, EASE helps you identify early warning signs and systemic weakness across layers (L1, L2, L3). This allows management to intervene and implement preventive actions before minor deviations escalate into critical quality or safety incidents.
The dashboards in EASE are fully configurable. Users can personalize their view by selecting from a library of available data visualizations and filtering data by location, department, shift, or specific process. This ensures that a Plant Manager sees multi-location coverage, while a Shift Supervisor sees real-time non-conformances and Action Plan status for their specific area, making the data relevant and actionable for every role.
Yes. EASE understands that quality data must integrate with the broader enterprise data ecosystem. The platform offers secure data export capabilities and access to a robust API (Application Programming Interface) or data warehousing solutions (through EASE Connect) that allow you to seamlessly extract your audit and Action Plan data for use in advanced Business Intelligence (BI) tools such as Power BI, Tableau, Qlik, and others, enabling unified organizational reporting.
Yes, EASE provides crucial closed-loop accountability reporting. The dashboards offer real-time tracking of non-conformance metrics, displaying completion percentages, overdue items, and the average time to resolution. Furthermore, the system allows for effectiveness verification by linking corrective actions back to the original audit findings. This enables you to measure if the implemented fix resulted in a sustained reduction in non-conformances for that specific process area, validating the preventive impact of your quality efforts.
See what else EASE can do.
Digital Audit Management
Cut down on non-value-added admin work with powerful, user-focused productivity tools.
Mobile Plant Audits
Enable on the go audits with real-time notifications and issue capturing, all from your mobile device — even when you’re offline.
On-the-Job Training
Upskill workers, decrease knowledge gaps, and get data that proves you’re improving.