Making the Most of Your Layered Process Audit Data

Layered process audit (LPA) programs generate prolific data from process audits that take place as often as multiple times per shift. Distilling actionable insights from the data sets can be overwhelming, so it’s important to ask—are you looking at the right data?
The answer lies in using a mix of both proactive and reactive data, and focusing on the critical few metrics driving your most important quality goals. Companies must also leverage internal resources to take action quickly, rather than getting bogged down in data collection and analysis.
Audit Data Overload
LPA programs require all layers of management from team leads to executives to conduct short audits at a frequency corresponding to their organizational level. Depending on the facility, this can total hundreds or even thousands of audits annually, potentially making it difficult to sift through audit data for meaningful insights.
Problems that can arise as a result include:
- Insufficient follow-up: One common pitfall of LPA programs—especially paper-based programs—is filing away the results and never looking at them again. It’s critical to analyze findings as soon as possible while you can still take preventive action, something that’s easier to do with automated reporting.
- Pencil-whipped audits: Over time, some people develop a tendency to rush through audits and automatically pass every item. When this happens, you’re still collecting data, but it’s essentially meaningless. Monitoring the time required to complete the audit can help identify pencil-whipped audits, such as when a 10-minute audit is completed in 30 seconds.
- Proliferation of metrics: Different divisions and groups often have their own quality metrics, creating a need to track dozens or even hundreds of key performance indicators (KPIs). Streamlining these KPIs is essential to making the most of your quality data, which we’ll discuss in more depth below.
Streamlining your Quality KPIs
One of the most important steps in getting value from LPAs and other quality activities is developing a set of just a few KPIs that the entire organization is focused on achieving.
Quality professionals may monitor a wider variety of metrics, but you can’t expect the entire organization to have the skill, time or patience for this level of detail. How do you select the right KPIs?
- Each one should relate to a core business goal.
- Limit your choices to only those that are critical to achieving results in a given area.
- Use a mix of leading indicators and trailing metrics.
Equally critical is making sure team members understand each KPI, how they can contribute and what they are expected to do daily to achieve quality goals. Communicating results regularly, such as by updating line-side visual management boards and/or online dashboards, helps engage and focus the team so everyone is pulling in the same direction.
Leading Indicators vs. Lagging Indicators
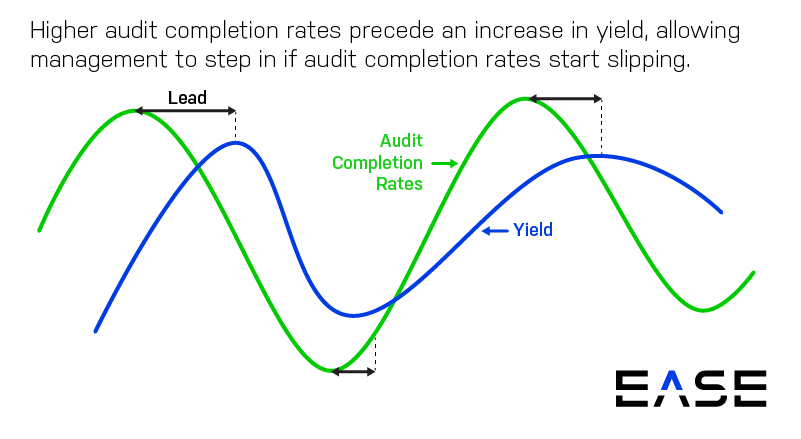
Getting the best results from your LPA program requires understanding the connection between leading indicators and trailing indicators. Trailing indicators measure the results you’re trying to achieve, while leading indicators predict whether you’re likely to be successful. It’s a predictable action/reaction relationship, like how a person with arthritis might have an aching knee before it rains.
For example, your LPA program might find that audit completion rates correlate with an increase in yield. Once you’ve made this connection, you can pay attention to areas with declining audit completion rates, taking action before the problem has an impact on quality.
Other examples of leading vs. trailing metrics are outlined in the table below:

Automated Layered Process Audit Reporting
Another reason some companies struggle under the weight of audit data comes down to a simple issue of resources. Some organizations consider quality an administrative task, with as little as 1% of staff allocated to quality management.
Audit software can help companies more efficiently leverage their resources, reducing administrative overhead by eliminating the need for manual data collection, entry and analysis. Automated dashboards can be configured to show your most important metrics, with some companies performing advanced functions like modeling with additional business intelligence software.
Compared to the vast majority of reactive, rear-facing quality data, LPAs represent one of the few sources of proactive data. The right set of metrics includes a small number of closely linked leading and lagging indicators, which allows you to prevent problems in real time. Automation is what eliminates the busy work, so you can spend more time on action and less time managing spreadsheets.