Prevention Detection Correction: Understanding the Costs

Benjamin Franklin once famously said, “An ounce of prevention is worth a pound of cure.”
Nowhere is this more obvious than in manufacturing, where preventing defects is a fraction of the cost of correcting them.
Despite this, prevention often takes a backseat, with quality teams forced to spend the lion’s share of their time putting out fires. To better understand the problem, today we’ll compare prevention, detection, and correction costs, as well as crucial changes in thinking necessary to reduce quality costs.
Download a free eBook on Cost of Quality: The Hidden Truth About Your Ultimate Quality Metric
The 1-10-100 Rule of Total Quality Management
Total quality management (TQM) espouses the 1-10-100 rule, which says that every dollar spent on prevention avoids $10 in correction costs and $100 in failure costs.
For instance, a 10-minute layered process audit can uncover a process nonconformance before hundreds or even thousands of bad parts are made. Detecting those defects after production could take hours of inspection time if those inspections could even detect the defect at all.
Correcting the problem, however, becomes a problem on an entirely different scale. Supplying bad parts to an OEM, for example, means not just replacing the parts (and tying up productivity doing so), but also paying for sorting costs. Then there are line stoppage fees, which for automakers like Toyota run $10,000 per minute. Should the product failure lead to a recall, the costs jump another order of magnitude into the millions (or beyond).
The Problem with Treating Prevention as a Cost Sink
It’s easy to look at systems and tools for prevention as yet another line item in the quality budget. The problem with this, however, is that prevention actually saves time and money by avoiding problems like equipment failures, recalls, and safety incidents.
Gauging the impact of prevention activities requires a closer look at the cost of quality.
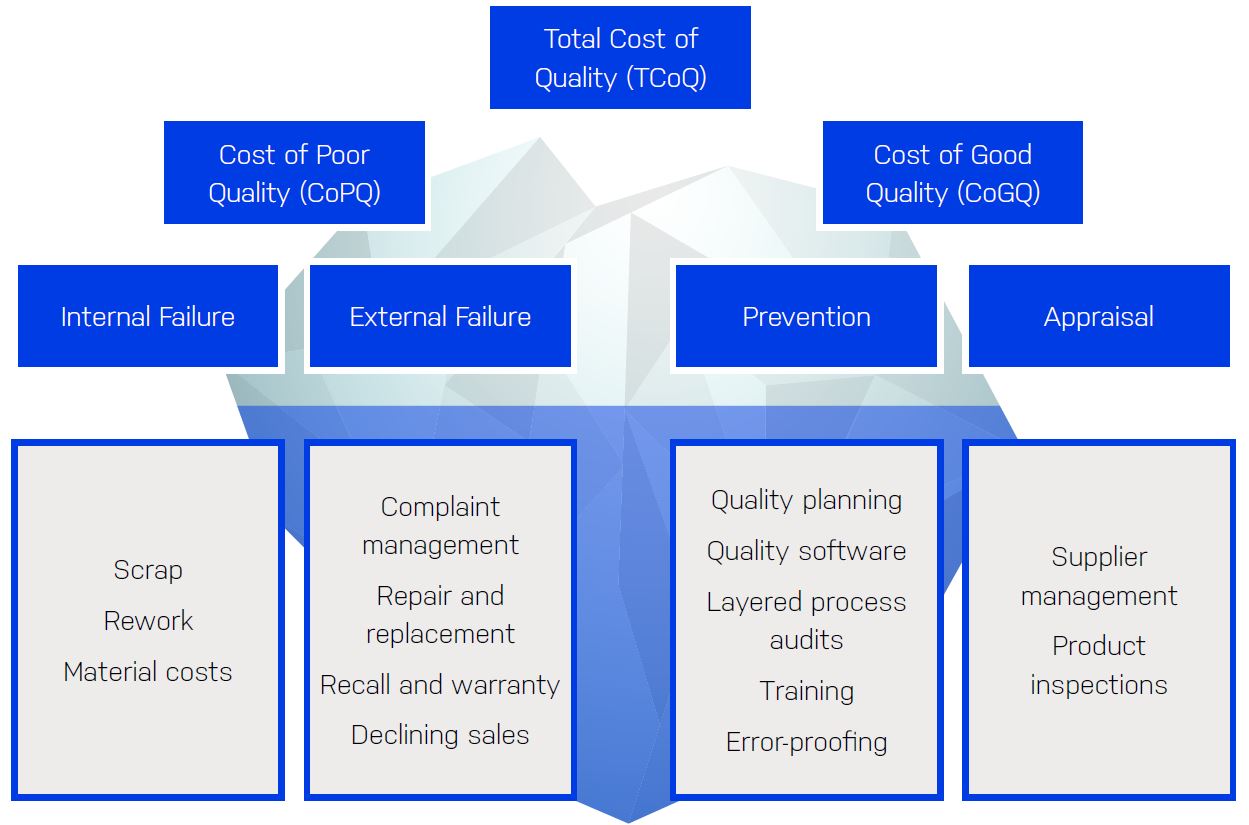
While the diagram above covers a wide breadth of quality costs, not all of them are created equal. Scrap alone, for example, can cost up to 2% of sales, according to American Productivity and Quality Center data. For a manufacturer with $100M in annual sales, that’s $2M that could be spent producing salable products.
Now consider that manufacturers have used high-frequency plant floor checks like layered process audits to cut scrap in half. In the above scenario, that would be a full $1M that goes right to the bottom line. So while scrap costs do nothing but subtract from profits, efforts to prevent scrap can actually provide a positive return on investment.
Why Detection Is Not Enough
There’s no question that detecting defective products before they reach customers is less expensive than correcting defects once products have been shipped. However, detection still falls short when it comes to reducing costs and preventing quality escapes.
Product inspections, for example, are rear-facing, meaning they can only address problems that have already occurred. Until those defects are identified, plants may continue churning out defective parts, further increasing the cost of detection, scrap, and rework.
It’s also critical to recognize that inspection can’t detect latent defects that result from process nonconformances. Latent defects are those that aren’t immediately apparent or even detectable at all with inspection. These can include structural weaknesses within a product, such as incorrectly tightened bolts that become loose under vibration.
Latent defects can also be related to material properties, only becoming apparent when the product undergoes environmental changes. The Takata airbag crisis is one example, where exposure to heat and humidity caused airbag propellant to break down over time, leading to failure.
The Hidden Costs of Poor Quality
Traditional definitions of the cost of poor quality (CoPQ) account for direct costs associated with correcting internal and external failures, including costs arising from:
- Scrap and rework
- Warranty claims
- Complaint management and corrective action
- Material costs and waste
- Recall costs
These costs are not insignificant, typically totaling 10-15% of revenue according to the American Society for Quality (ASQ). And yet, these costs are only the tip of the iceberg. Below the surface are many more hidden (and unaccounted-for) costs, such as lost opportunities, reduced productivity, lower employee morale, and declining brand value.
In this context, it’s also important to understand the “hidden factory,” which refers to those undocumented processes that work against quality by introducing variation and inefficiency. One example is when an operator adjusts the process to speed it up or rework a part, causing problems when that person isn’t working at that station.
The Key Role of Process Verification
Taken as a whole, it’s clear that prevention is the most powerful tool plants have for leveraging down the cost of quality. Measures like quality planning, employee training, and error-proofing systems all go a long way toward preventing problems, but they all require one critical element: verification.
Plant floor checks like layered process audits provide that key element, closing the loop to ensure people actually follow documented processes and systems are working as intended.
By verifying processes rather than just products, these checks reduce detection and correction costs while revealing hidden factory processes working against quality. A digital audit and inspection platform like EASE can provide that critical link, at a cost far lower than many quality escapes.