Quick Guide to Leading Indicators for Plant Managers


When you come back to work after being away on vacation, how do you know whether it’s going to be an easy day or a hard day?
For many, the first place they look is their inbox. If you’ve got dozens (or more) unread messages, many marked urgent, your blood pressure may start to rise immediately. If you’ve only got a few, you may find yourself breathing a sigh of relief.
Knowing that an overflowing inbox means a crazy day, you might even check your email before you get back so you aren’t unknowingly walking into a disaster.
In this example, the number of unread emails in your inbox acts as a leading indicator of how busy your day is likely to be. Similarly, leading indicators can provide critical information to plant managers responsible for keeping a pulse on plant health, allowing them to take action before problems occur.
In this post, we provide a quick guide to leading indicators for plant managers, including examples of metrics that can unlock key insight into systems that need checking.
Download our free automotive case study
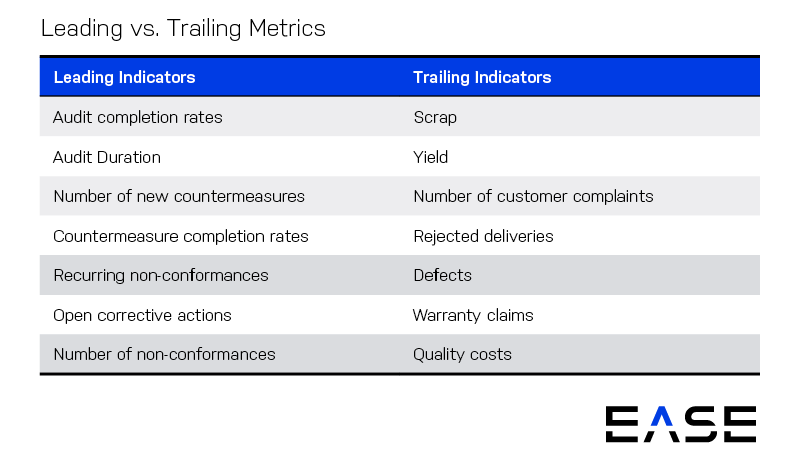
Leading vs. Lagging Indicators
While most organizations already track lagging indicators, a lot of confusion exists around leading indicators. So before we jump in, let’s start with some basic definitions:
- Lagging indicators: Lagging metrics or indicators are aimed at the results you’re trying to achieve. Lagging indicators are often the fires plant managers must put out, such as customer complaints or defect rates.
- Leading indicators: Leading metrics look at inputs that signal potential changes in lagging metrics, or areas where you might see problems in the future.
One common example of a safety leading indicator is near-misses, or incidents where an injury almost happened but didn’t (usually due to sheer luck). Near-misses indicate gaps in safety controls, which is why they often precede actual injuries. Thus, if you see a spike in near-misses—or even a single near-miss—you should investigate and take action immediately.
Developing Leading Indicators
Plant managers should coordinate with the executive or leadership team to develop leading indicators, drawing on information from areas such as enterprise resource planning (ERP), quality management system (QMS) and/or production system data.
What does the overall process look like?
- Begin with the end in mind: Start with a specific strategic goal, such as reducing customer complaints or warranty costs.
- Determine how to get there: Second, determine tactics to achieve that goal, such as implementing layered process audits (LPAs). LPAs are high-frequency audits that verify process inputs to identify variation that could cause defects.
- Measure that systems are working: Finally, measure how well your tactics and systems are working.
Examples of Leading Indicators
It’s important to pay attention to both indicators of how well systems are working, as well as how the plant as a whole is working. The first category is important because systems such as LPAs and corrective actions are themselves leading indicators of problems in plant performance. Leading indicators of how systems are working include:
- LPA completion rate
- Number of overdue corrective actions
- Average time to closure for corrective actions
- Number of new controls or countermeasures
Plant leading indicators include items such as:
- Total number of nonconformance findings on LPAs
- Clusters of findings in certain areas
- Number of repeat findings
Other leading indicators our team at The Luminous Group has used include:
- Amount of internal scrap: If you make it, you will eventually ship it.
- Amount of expedited shipping: If the plant is rushing to fill orders, mistakes are more likely to occur.
- Employee turnover rates: New employees may not be fully trained or experienced in doing their jobs.
Leading metrics don’t have to be causative or directly tied to changes in a lagging indicator. Rather, leading metrics are indicative of where problems could be happening, pointing to systems and areas that need attention from plant managers.
Leading indicators are unique to each organization, and you may identify ones not discussed here. What’s important is to start the process of tracking them, which will allow you to stop simply fighting fires and start preventing them in the first place.
