Root Cause Analysis: How to Use a Fishbone Diagram
When tasked with solving a problem, brainstorming potential causes is a good place to start. However, without a way to organize the information visually, it can be hard to see how different facets of the problem interact.
One visual method of root cause analysis that helps do just that is to create a fishbone diagram.
Using this method allows you to visualize and organize potential causes of a problem into a useable framework for solving it. Here we look at the basics of how a fishbone diagram works, as well as some examples of how to apply it in your facility.
Easily create, customize, and present your own fishbone diagram with our free downloadable set of templates!
What is a Fishbone Diagram?
A fishbone diagram, also called an Ishikawa diagram, is a visual method for root cause analysis that organizes cause-and-effect relationships into categories.
Popularized in the 1960s, the Ishikawa diagram was used as a basic tool of quality control by Kaoru Ishikawa at the University of Tokyo. It is considered part of The Basic Seven tools of quality control today.
Over time, it was nicknamed the fishbone diagram due to its resemblance to a fish skeleton laid on its side, which helps visualize possible causes.. At the mouth of the fishbone diagram goes the problem you’re trying to solve. Each of the bones feeding into the spine of the fish represents a specific category of potential contributors to the problem.
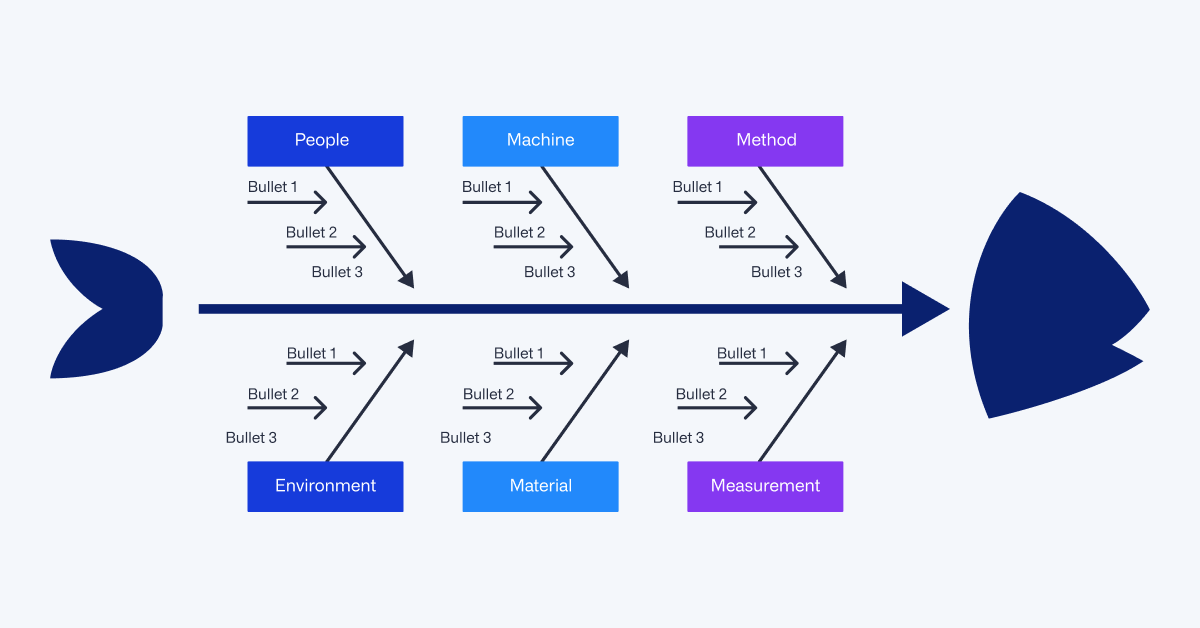
While the categories of causes can change, the most commonly used are those that help to draw a horizontal effect diagram:
- People
- Machine
- Method
- Measurement
- Material
- Environment
Under each category of causes is where you add elements that could impact the process associated with that cause and effect diagram. It’s worth noting that each category may also have various sub-causes, which can be analyzed using the 5 whys technique. For a great example, see the American Society for Quality (ASQ) glossary entry on fishbone diagrams.
People
This category is for anything related to the people associated with the cause and effect of the process. Operators are the most common group in this category, but it can also include maintenance teams, quality control specialists and supervisors.
Potential causes in this category include:
- Operator did not complete training
- Employee can’t physically see defect
- Maintenance used incorrect tool
Machine
This category is for all elements related to the machines used in a process. Depending on the process, this category could capture anything from pouring robots in a foundry to printers in a book shop.
Some examples of causes in this category are:
- Preventative maintenance schedule not followed
- Broken or missing parts on the machine
- Machine doesn’t have correct tool head
Method
This category is for process documents and instructions that include a cause-and-effect diagram. Here is where you would review any instructions used during the process being evaluated. Look at whether the instructions accurately describe the process, if they prevent a defect from occurring, or even whether a picture is clear enough to illustrate the 5 whys.
Examples of causes here could be:
- Instruction book not in station
- Instructions didn’t plan for this defect
- Instructions aren’t detailed enough
Measurement
This category of the fishbone diagram captures any techniques used to measure whether a part or process meets the desired quality standards. You might include information on scales, vision systems or human inspectors here, as well as sub-causes such as:
- Gauge R&Rs were not completed
- Scale doesn’t function properly
- Measuring tool broke off or is missing
Material
This category captures the materials involved in a given process. Whether raw materials or inspection materials such as soapy water sprayed on a tire to detect leaks, anything added during a process can impact quality. In this area of the fishbone, you review every material that goes into a process to weigh its potential impact on the problem statement.
Potential factors in this category include:
- Base material is defective
- Part number called out does not match part number being used
- Material feature out of tolerance
Environment
This category is for relevant external factors at different points in the production process, including storage and the work area itself. For example, you might consider environmental temperature, humidity, or pressure as contributing factors when searching for a root cause using a fishbone diagram. Problems in the plant that prevent consistent environmental conditions could be the source of your possible causes.
Here you might find problems in areas such as:
- Air conditioning vent blows on gauge, altering reading
- Hole in roof lets rainwater fall onto material racks
- Open windows allow wind to blow over tables and stands
A fishbone diagram is a simple yet powerful way to brainstorm potential causes of problems and how they interact. Using one during your next brainstorming session can help you narrow in on the root cause of problems, giving you a holistic look at quality issues and where to focus your problem-solving.
Once you’ve identified the root cause, the next step is eliminating the chance of recurrence. The corrective action is just the start, as it’s essential to check back in on problems to ensure the fix is still in place and that no new cause of the problem has emerged. A layered process audit program and automated platform like EASE can help, giving you the ability to easily add questions based on corrective actions and report on findings immediately.
Ultimately, this combination of problem-solving, corrective action and high-frequency audits are key to continuous improvement, also providing a framework for a culture of quality.