The Aerospace Guide to Leading Indicators


Every day we glean insights from signals that show when a change is coming or we need to take action.
The smoke alarm goes off when you’re cooking, alerting you to turn down the burner. Your engine starts making a funny noise weeks before your car breaks down. That old injury starts to ache just before a storm front moves in.
In quality and manufacturing, we call these leading indicators, or measures that predict performance outputs. For aerospace suppliers in particular, mastery of leading indicators can help build a competitive advantage in an industry where many companies compete for the business of relatively few OEMs.
Getting to mastery, however, requires a solid understanding of how leading indicators work and how to effectively track them.
Understanding Leading Indicators
Before we look at examples of leading indicators, it’s important to make the distinction between lagging and leading indicators:
- Lagging indicators measure outputs or results you’re trying to achieve.
- Leading indicators measure inputs or conditions that predict changes in those results.
Below are a few examples of leading vs. lagging indicators:
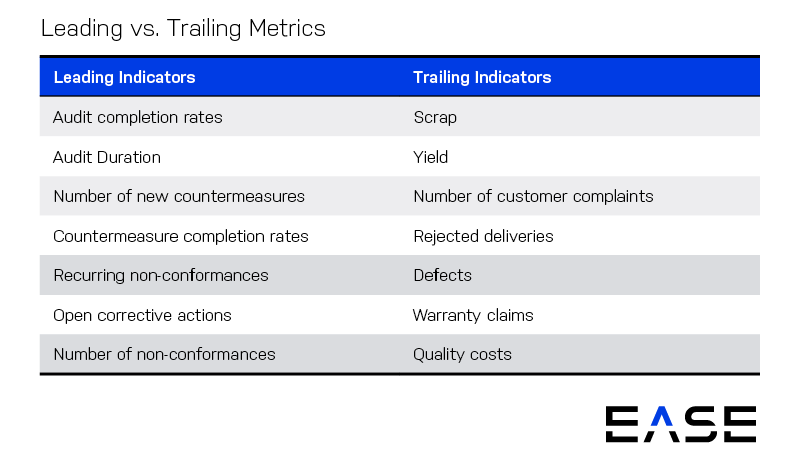
The simplest way to visualize this is in graphical form. In the image below, comparing trends shows that when audit completion rates go up, so does yield. Tracking audit completion rates means that if they start to slip, you can take proactive steps to prevent a fall in yield.

It’s worth noting that leading and lagging indicators may be inversely correlated. That is, when the leading indicator goes up, it may predict a drop in the lagging indicator (or vice versa). An example would include audit duration and defects—when audits get super-short (usually a sign of pencil-whipping), you might see defects go up.
Types of Leading Indicators
There’s no one-size-fits-all when it comes to leading indicators, and your leading indicators will depend on your organization’s processes and performance. Because a single lagging indicator may have several leading indicators, selecting leading indicators requires careful consideration of how you plan to use the numbers. Each metric should connect to a core business goal—otherwise it’s just a meaningless number.
Leading indicators can measure operations or processes, as well as behavioral inputs that correlate with quality culture elements you’re trying to grow. Types of leading indicators you might measure include:
- Process compliance metrics from audit findings to identify variation from standardized procedures
- Equipment maintenance numbers such as mean time to failure (MTTF) and preventive maintenance compliance
- Risk mitigation elements such as number of risk assessments and new countermeasures
- Corrective action metrics like time to closure and number of overdue requests
- Audit completion rates, both on the shop floor and at the management level
- Supplier metrics such as on-time delivery and corrective actions
- Budget-related metrics such as total amount allocated to new countermeasures or employee training programs
Tracking Leading Indicators
Monitoring leading indicators closely over time allows organizations to adopt a proactive stance to quality issues. Best practices in tracking key performance indicators (KPIs) focus on:
- Communicating results: You can’t achieve operational excellence unless everyone is working towards the same goal. In addition to keeping line-side visual management boards and online dashboards updated, you also have to make sure everyone understands the KPIs and how their work impacts each metric.
- Streamlining metrics: Avoid the pitfall of too many metrics. Choose a handful of leading and lagging indicators, saving the detailed data for specialists who have the time and skillset to dig deeper.
- Timely data analysis: Many companies struggle to use data while it is still actionable, taking weeks or months just to compile it. Lag time increases the potential impact of quality escapes, giving companies with real-time reporting a distinct advantage.
Gathering Source Data for Leading Indicators
Data for developing leading indicators can come from a wide variety of sources. Many aerospace manufacturers are turning to layered process audits (LPAs) as a way to gather detailed information on shop floor processes. These process audits:
- Check items critical to quality each shift with short audits
- Involve everyone from front-line operators up to executives
- Make quality part of everyone’s daily responsibility
- Create opportunities for problem-solving and face-to-face communication
- Help aerospace organizations with small quality teams achieve bigger results
LPAs provide large data sets for developing leading indicators around audits, process compliance and corrective actions, with automated LPA providing live data and closed-loop management of non-conformities.
Taking the time to develop leading indicators that enable better decision-making is a foundational requirement for operational excellence and a culture of quality. It all comes down to making the transition from a reactive approach focused on putting out fires to a proactive one that prevents problems before they occur.