Top Layered Process Audit Metrics You Should Be Tracking


When implementing layered process audits (LPAs), manufacturers expect these high-frequency checks to help them improve key performance indicators (KPIs) around defects, complaints and scrap.
Achieving this goal, however, depends on whether plants can effectively manage the LPA system itself—and correlate layered process audit metrics with other KPIs.
With that in mind, this article looks at some of the best layered process audit metrics manufacturers can track. We discuss how to get started with layered process audit metrics, as well as more detailed metrics around audits, findings and mitigations.
Download your free Ultimate Guide to Layered Process Audits for more LPA question best practices, examples and tips
Top 3 Metrics for Getting Started
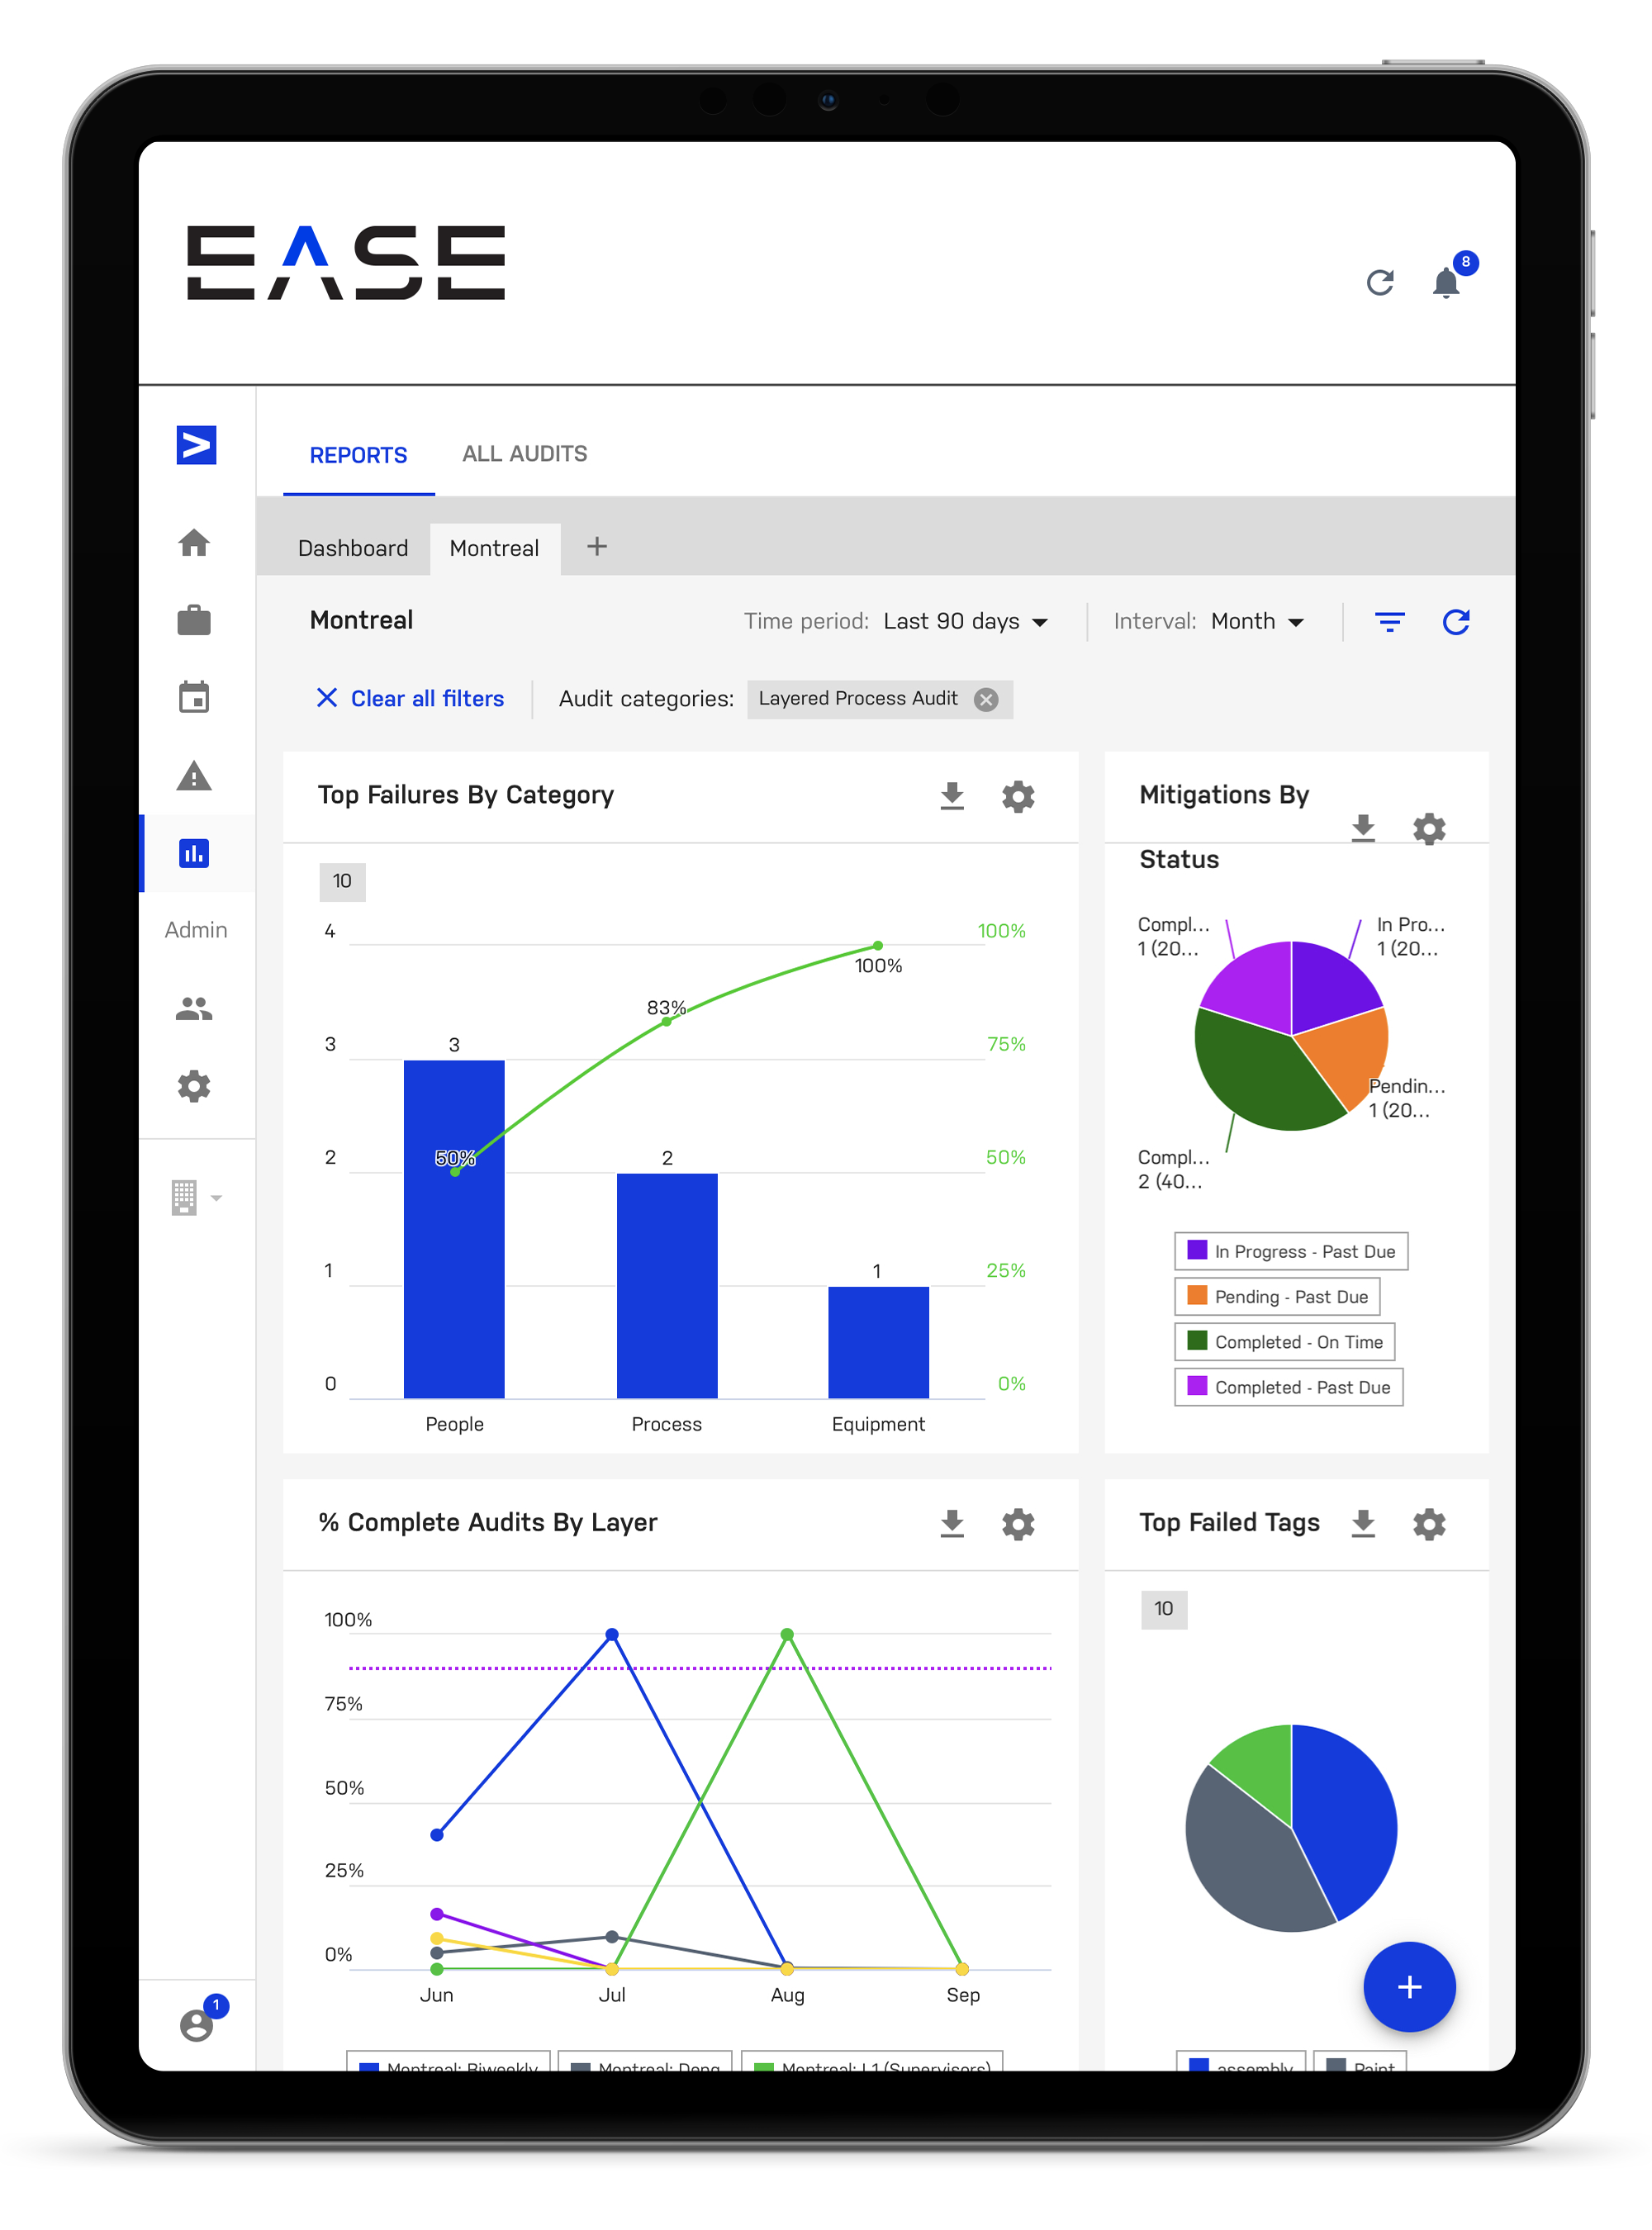
If you’re just getting started with layered process audits or have just deployed LPA software, three metrics we at The Luminous Group recommend putting on your dashboard are:
- Percent of audits completed: Are you getting audits completed, providing the necessary visibility to solve issues?
- Audit findings over the last month: Does the number of findings continue to go up, or are they going down because you’re resolving problems completely and they are not reoccurring?
- Number of open findings: Are you closing out findings and addressing issues, or is the number of open findings going up?
If you only tracked these three metrics for the first few months of using LPA software, it would give you a good grasp of the health of your LPA system. You would know the level of participation in your LPA system, whether you’re solving problems or if they’re reoccurring and if people are reacting to findings in a timely manner.
Audits Completed
Some plants never move beyond the metrics discussed above. But to move to the next level, you need to start looking at whether people complete audits on time and are paying attention to the schedule.
Metrics to track here include:
- On-time completion rate
- Completion rate by layer
- Completion rate by work area
LPA software like EASE helps ensure people conduct checks at the appropriate time. For example, you don’t want supervisors completing all five of their scheduled audits for the week on a single day. The reason is that this is just a check the box approach, and tells you nothing about variation on the plant floor over time. With a digital system, auditors only have access to the checklists on the day of their scheduled audits.
A core tenet of layered process audits is that everyone should audit. This creates a culture where quality is everyone’s job. When we look at audit completion by layer, it highlights whether management is actively involved in the LPAs. Checking to make sure that every work area completes their audits ensures that you aren’t blindsided by a quality spill that you thought LPAs would help prevent.
Audit Findings
This category of LPA metrics refers to the number of audit questions answered ‘no,’ in other words where a question failed. Here you’ll want to track metrics such as:
- Number of audit findings by time period: This metric can help you identify large-scale trends over time, including any recurrences across multiple work areas in a given time period.
- Number of findings by work area over a given time period: Here you can see whether specific problems are coming up. For instance, is there weakness in the injection molding area, or maybe stamping?
- Number of findings by layer: If layers 2 and 3 are uncovering a lot more issues than layer 1, it points to a problem. Maybe the layer 1 auditors need more training, or maybe they don’t have the time to complete audits. Layer 1 is the supervisor’s daily check that should catch problems right away, meaning that layers 2 and 3 should be finding fewer issues.
Mitigation Metrics
This type of LPA metric refers to corrections or corrective actions taken on findings. The LPA system is meant to drive action. If it is not driving change, it is not valuable. Specific metrics to track here include:
- Number of open findings by area: This metric can reveal specific work areas that aren’t problem-solving effectively and need help fixing quality issues.
- Mitigations that are late: This metric helps you identify when people aren’t completing assigned action items.
- List of oldest mitigations that are open: Here you can see where management may need to allocate more resources to problem-solving. For example, you may need to get an engineering manager involved to find out why an issue isn’t closed yet.
Comparing LPA Metrics with Business KPIs
In tracking LPA metrics, it’s essential to compare those numbers against real-world KPIS to identify trends at a deeper level. Two common ones you should consider are findings versus scrap and findings versus complaints.
Looking at findings versus scrap in a given area tells you important information about the quality of your LPA questions. As findings go down, so should scrap. If that’s not true, you should look at scrap reports. What are the key input variables that are leading to scrap? Does the LPA system ask questions about those inputs?
Tracking findings versus complaints plantwide shows you how well your LPA system is working. If overall number of findings is going down and complaints aren’t, that shows you need to reinforce your control plan. The key question to ask here is why you aren’t catching those issues leading to complaints.
Depending on where you are in your LPA journey, you may start with basic metrics like audit completion rate, your past month’s findings and number of open findings. As you go deeper, however, you’ll want to get more granular with metrics related to audit completion, findings and mitigations.
It’s also critical to compare LPA metrics with real-world KPIs so that you can ensure you’re achieving your goals overall. A digital LPA system like EASE simplifies the process, so you can spend less time on paper checklists and spreadsheets and more time understanding what your data is telling you.