Using the 80/20 Rule to Improve Quality in Auto and Aerospace Manufacturing


Pareto’s Law, also known as the 80/20 rule, tells us that 20% of inputs are responsible for 80% of results. Even when it’s not an even 80/20 split, the idea that a few factors drive a large proportion of outcomes applies to many business processes and everyday situations.
Like how a majority of complaints often result from a few key defects. Or how 20% of our time accounts for 80% of our productivity, with the remaining 80% spent on meaningless tasks.
In the automotive and aerospace industries, organizations can use a range of tools to leverage the 80/20 rule for bigger, faster quality improvements. Pareto management is the most obvious of these, but manufacturers should also apply the rule to performance metrics, risk management and audits.
Getting More from Pareto Charts
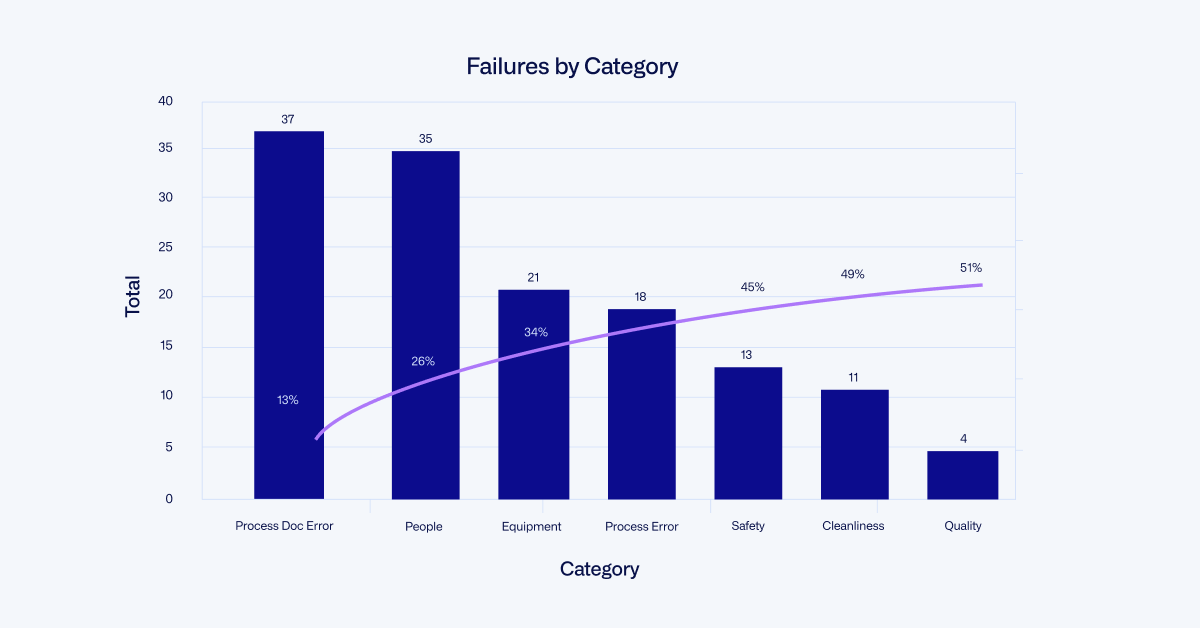
Pareto charts are a core tool for identifying issues that have the greatest impact on performance. The chart combines a bar graph and a line graph to show the relative frequency or cost of different types of problems, and is useful for prioritizing action. In the example below, addressing process errors will do more to reduce failures than fixing any other issue.
To get better results with Pareto charts, focus on strategies such as:
- Leveraging the second y-axis: Many organizations underutilize the line corresponding to cumulative percent. If your goal is to reduce failures by 50%, you can see exactly what you need to do to get there.
- Making buckets more specific: Often people make categories too broad. If you have a single bar for electrical issues, how is that actionable when it refers to everything from grounding to magnetic fields protection? You need to understand the components within that bar to know how to act effectively.
- But not too specific: Conversely, buckets that are too granular—say a Pareto chart with 1,000+ issues—will be difficult for higher levels of leadership to absorb.
- Combining Pareto charts: You can add Pareto charts together for a high-level view of what you need to control. For instance, automotive manufacturers might combine a Pareto from chassis design with one from chassis manufacturing for a single Pareto of quality issues for chassis.
Identifying the Vital Few Quality Metrics
Beyond Pareto charts, separating the vital few from the trivial many applies to reporting as a whole. Different departments may track hundreds of key performance indicators (KPIs), making it hard to collaborate on goals and results.
Instead, organizations should:
- Streamline their metrics: Pare it down to just a handful of KPIs, each tied to a core business goal where the metric has a big impact.
- Mix leading and trailing indicators: Trailing indicators measure results, like scrap costs or defects. Leading indicators predict a change in outputs, like when increasing audit completion tends to precede an increase in yield. Tracking this leading indicator means when audit rates start going down, you can step in before yield takes a hit.
- Proactively communicate results: Building a culture of quality means making sure team members understand each metric and what their daily expectations are to achieve those goals. Keeping line-side visual management boards and/or online dashboards up-to-date is also a must for keeping the team focused and motivated.

Prioritizing Risks with Failure Modes and Effects Analysis
Failure modes and effects analysis (FMEA) is a useful tool not just for exploring all of the potential ways a product or process can fail, but also for identifying the 20% of risks likely to cause 80% of failures.
It’s worth noting that companies often miss out on the full value of FMEAs by failing to make them an iterative process. It’s essential to continually refine FMEAs based on results, helping you find other opportunities missed in previous versions.
Mitigating Risks with Layered Process Audits
Layered process audits (LPAs) are a type of high-frequency audit conducted by multiple layers of management, with audits taking place several times per shift. Compared with inspections that may or may not find individual defects, LPAs identify and prevent process errors that cause a large number of defects.
Leading automotive brands like Chrysler and GM require suppliers to conduct LPAs, and aerospace is also starting to discover how quickly these audits can reduce defects and create a culture of quality.
Because LPAs are so short—only about 10 to 15 questions—teams must focus on a select number of process inputs known to drive the highest number of problems. The questions come from a variety of sources, including complaints, Pareto charts and process FMEAs (PFMEAs).
In quality as in life, there are only so many things we can do in a given day. Making the most of our time and resources requires an ability to separate the vital few from the trivial many. Essential to leveraging the 80/20 rule is shifting from reactive fire-fighting to proactive prevention, so you stay focused on the 20% of risks instead of just barely keeping up with the 80% of problems they cause.