Total Quality Management (TQM): A Primer
What do Toyota, Phillips and Konica Minolta have in common?
All of these (and many more) companies have used total quality management (TQM) to transform their operations by putting customers at the center of everything they do.
TQM encompasses a variety of classic quality control techniques. More than just tools, however, it is a philosophy for getting everyone from CEO to machine operator involved in creating a culture of quality.
In this primer, you’ll find a brief overview of this approach, including its origins, core principles and tools.
What is Total Quality Management (TQM)?
Total quality management (TQM) is a strategy for systematic quality improvement popularized in the 1980s. The U.S. Naval Air Systems Command first used the term to describe its quality approach, which it based on principles from experts like W. Edward Demings and Kaoru Ishikawa.
Principles of Total Quality Management (TQM)
TQM focuses on 8 principles:
- Customer focus: The end goal is to create products that meet the customer’s needs and expectations.
- Employee participation: Every employee should take personal ownership of quality
- Process thinking: Companies must define their processes and establish performance metrics to detect variation.
- Integration of processes: This philosophy aims to bring together siloed processes to achieve organization-wide quality.
- Strategic management: Quality must be a core element of the organization’s strategic planning activities.
- Continuous improvement: Continuous improvement is at the core of this approach, aiming for steady progress toward quality goals.
- Data-based decision making: Tracking performance data is essential to making strategic decisions.
- Effective communication: Getting team buy-in and participation requires effective communication about goals, performance and progress.
Total Quality Management Tools
While there isn’t broad agreement on what constitutes TQM, the Navy’s approach was based on several core quality tools used in many organizations today.
First and foremost is the Plan-Do-Check-Act (PDCA) process approach. PDCA allows companies to be proactive about documenting their processes and performance goals, then closing the loop by checking and making adjustments.
Second, TQM focuses on establishing separate cross-functional teams whose job is to address both immediate problems as well as long-term process improvement. Management participation is also key, ensuring organizational buy-in and laying the foundation for a culture of quality.
Finally, TQM uses the Seven Basic Quality Tools outlined by Karuo Ishikawa:
- Ishikawa or fishbone diagrams
- Check sheets
- Control charts
- Histograms
- Pareto charts
- Scatter plots
- Stratification of data
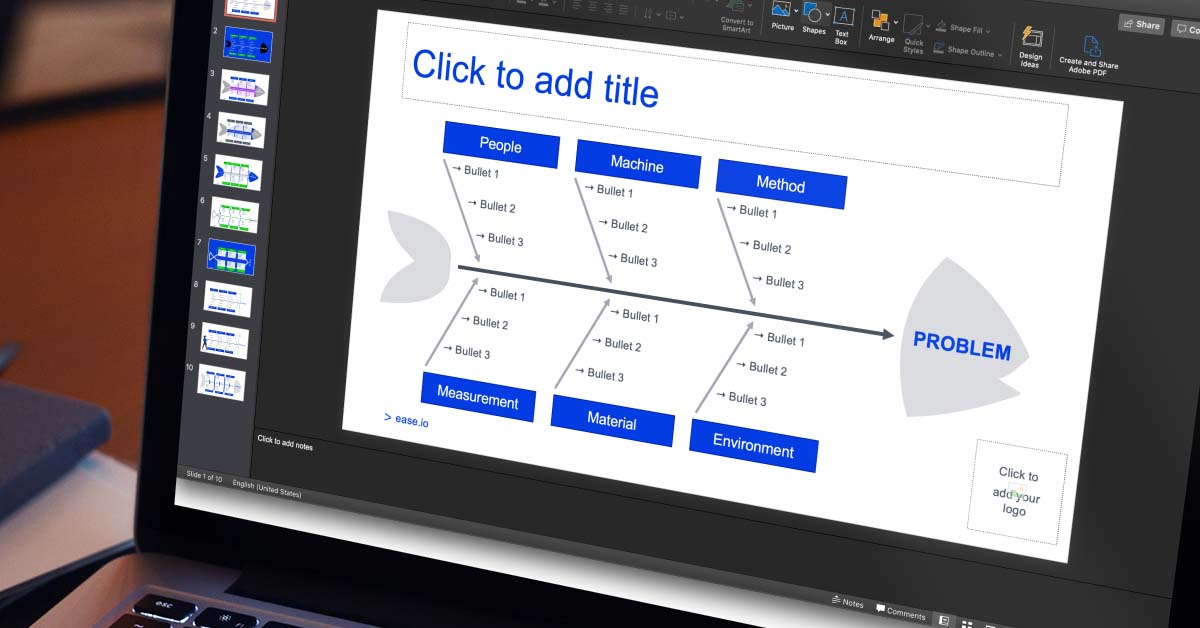
Fishbone diagrams (Ishikawa diagrams)
Fishbone diagrams, also called Ishikawa diagrams, help teams explore potential root causes of a problem. Each bone in the fish represents a specific category of root cause such as:
- People
- Machine
- Method
- Measurement
- Material
- Environment
Check sheets
Check sheets are used for collecting and analyzing observational data, for example when conducting a plant floor audit such as a layered process audit (LPA).
Control charts
A control chart is a type of graph that shows how a process has changed over time. Historical data is used to establish upper and lower control limits on a control chart to show when a process is in or out of control.
Histograms
Histograms are charts that display frequency distributions, grouping numerical data into buckets. They can help assess whether data are normally distributed, compare process outputs or evaluate process change across different periods of time.
Pareto charts
Pareto charts help visualize the relative contribution of different factors. Based on the Pareto principle or 80/20 principle, Pareto charts show cumulative count and therefore which factors contribute the most to a quality issue.

For example, audit software like EASE plots plant floor audit data to identify where process issues are occurring that could lead to production defects.
Scatter plots
Scatter plots graph pairs of data to help assess whether a relationship exists between two variables. When the coefficient of determination R2 is close to one, it indicates correlation between independent and dependent variables.

Stratification
Stratification involves sorting or grouping data from different sources to identify patterns. For example, you might stratify data within a scatter plot by department, supplier or materials to show relationships between variables.
Total Quality Management in Context
Total quality management is a broad term that incorporates many different foundational quality control concepts. While TQM was more prevalent in the 1980s, many companies still use it today as the basis for their quality strategy.
For many, this approach goes far beyond control charts and fishbone diagrams. Instead, TQM has become a guiding philosophy and way of life, with the goal of creating a culture where quality is embedded in the company’s DNA. Read more about quality management system here.